Introducing New and Improved Tools to Help You Find the Best Location
Like any business with hopes of long term success, we are constantly working on better, more efficient solutions for our clients. Fortunately, we’ve heard a lot of good ideas from them over the years. We’re excited to announce that we’ve been able to put those ideas into action and have created one entirely new tool and have completely revamped another. I’ve outlined below the highlights of the reports but if you’re just interested in taking a look, here is a link to our sample reports.
All New County Reports
First, let’s discuss the new offering. One request that we have received quite a few times is from a doctor not tied to any particular city, someone who simply wants the best location that the country has to offer. The problem is, answering that question is more complicated than it might appear on the surface. Since we started, Dentagraphics has always offered state level data for free on its homepage. But let’s say you’re interested in learning about Texas. Familiarizing yourself with the state as a whole is a good place to start but it doesn’t detail the differences between the state’s big markets of Houston, Dallas-Fort Worth, San Antonio, Austin and El Paso. Nor does state level data tell you about the differences between these large urban centers and their suburbs or the state’s many rural communities. We need finer grain data to make those distinctions. Historically, this is where the Area Analysis came into play. But manually verifying every competing practice, collecting demographic data and presenting it in a handwritten report for multiple large urban markets was time-consuming for us and costly for you.
Enter the County Report. We’ve designed this study to maximize the size of the area studied (the entire country!) while minimizing your investment and getting the ball rolling when the options are numerous. There are a few key benefits to this approach. First, access to our database detailing data across the entire country at the county level is only $99 for one month, $199 for three months or $299 for six months. But no need to wait, the results are instant. Even better, we also include a complimentary consultation call to discuss your search with you and how to interpret the data as you decide where to practice.
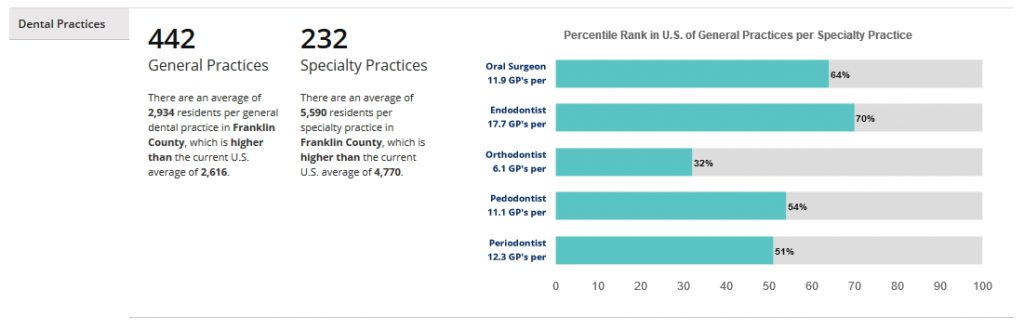
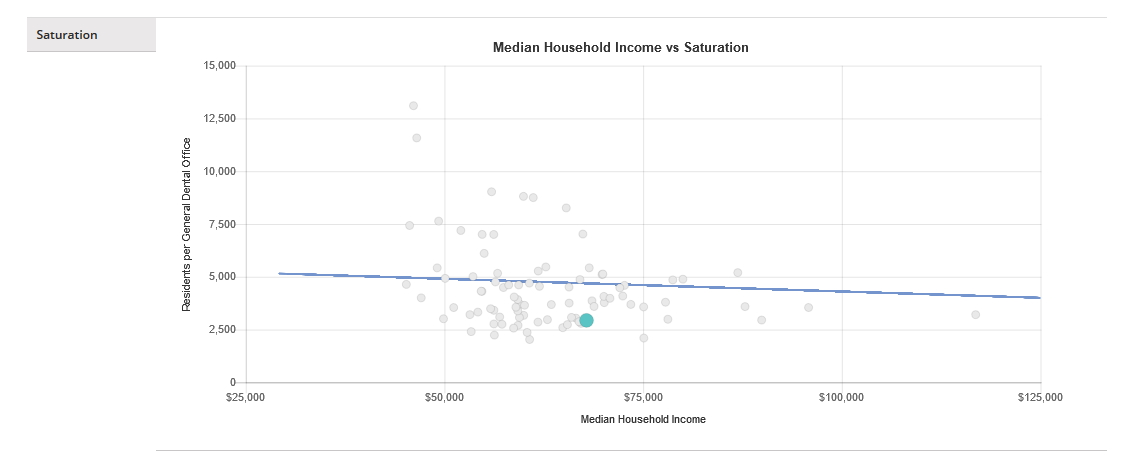
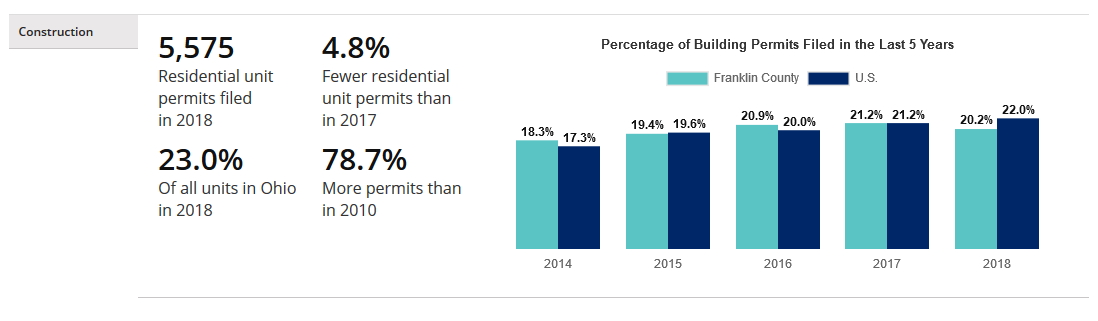
But what kind of data is included? For any county that you wish to analyze, the County Reports display population, practices categorized by specialty (and how the level of competition compares to other counties nationwide), key demographic factors like household income and observed population growth rates and even the number of building permits filed. You’ll receive instant access to the most up-to-date info as the number of competing practices is updated daily.
One caveat with this tool is that for medium and large counties the data presented is a generalization of conditions. Counties like Los Angeles (with a population of roughly 10 million) have lots of sub-markets, meaning that some areas will be better than others. Just because a county rates favorably or unfavorably does not mean that every location in that county would receive a similar rating. Rather, this study helps us to quickly find where we should conduct a more refined search - areas which generally offer better opportunities.
The Revamped Single Site Study
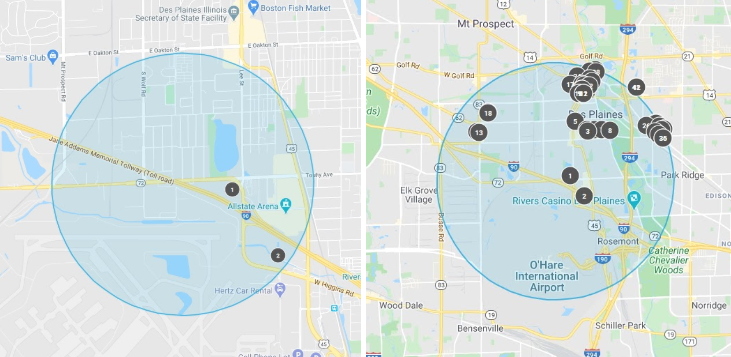
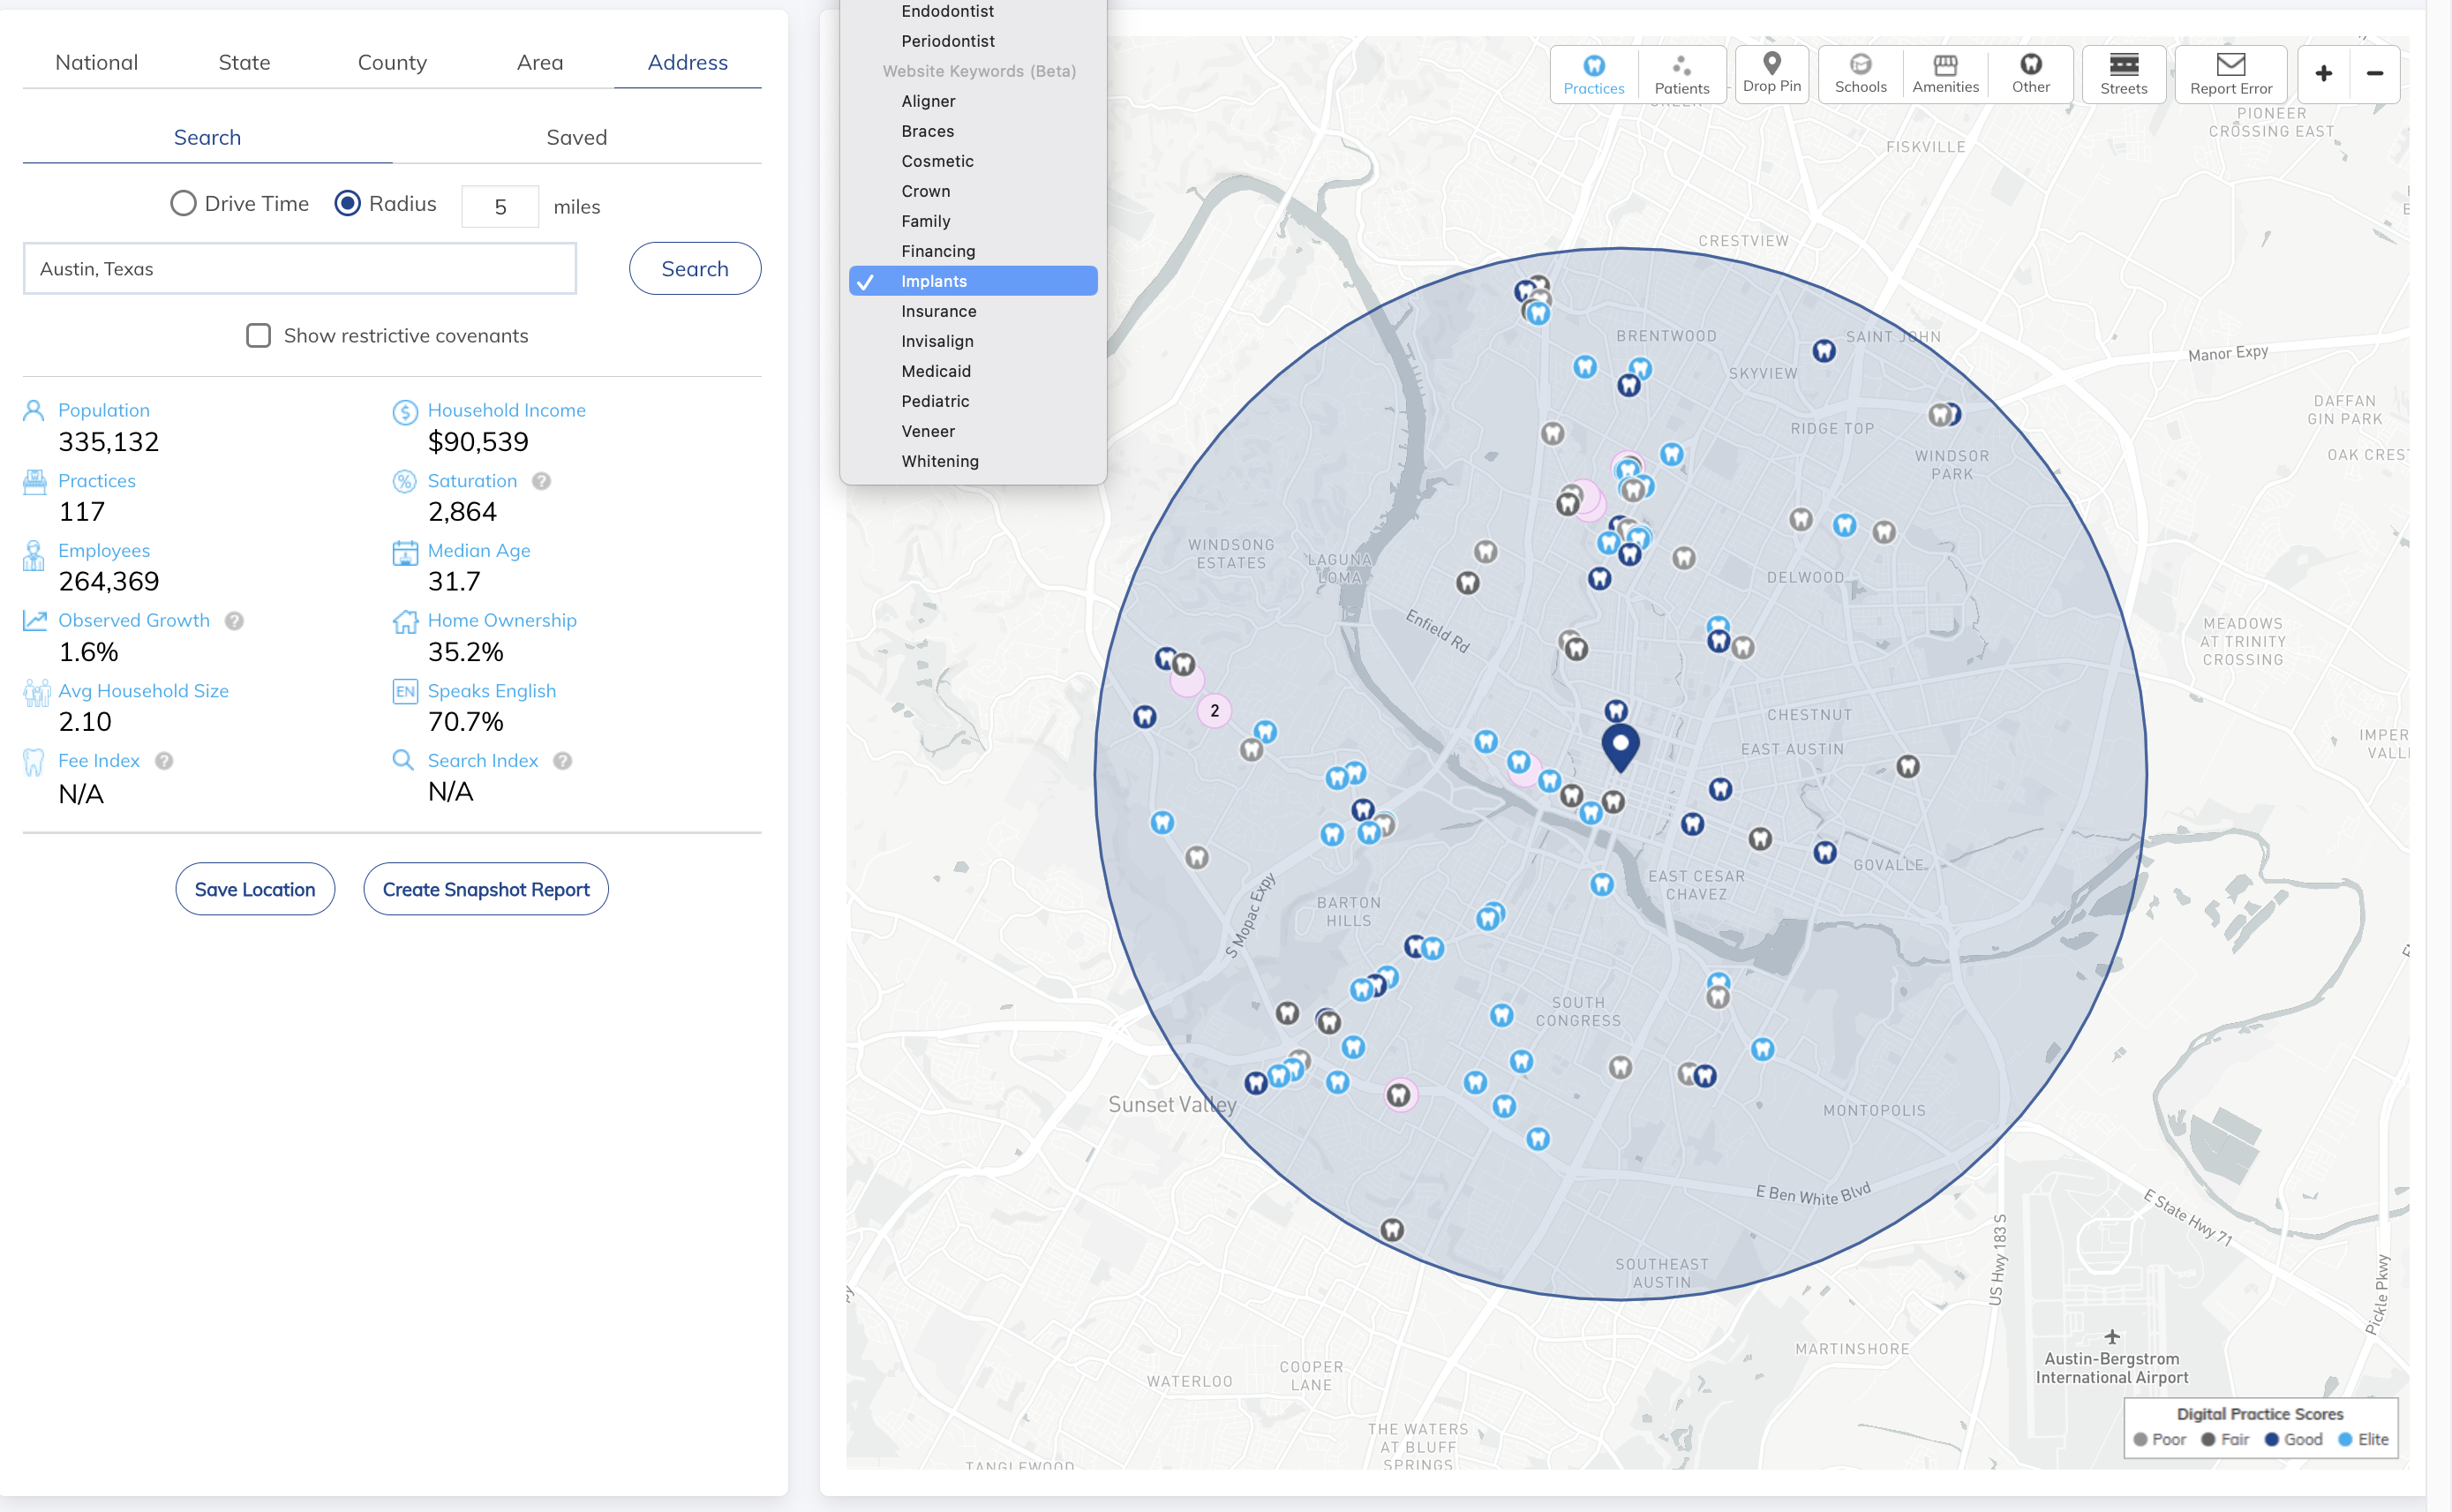
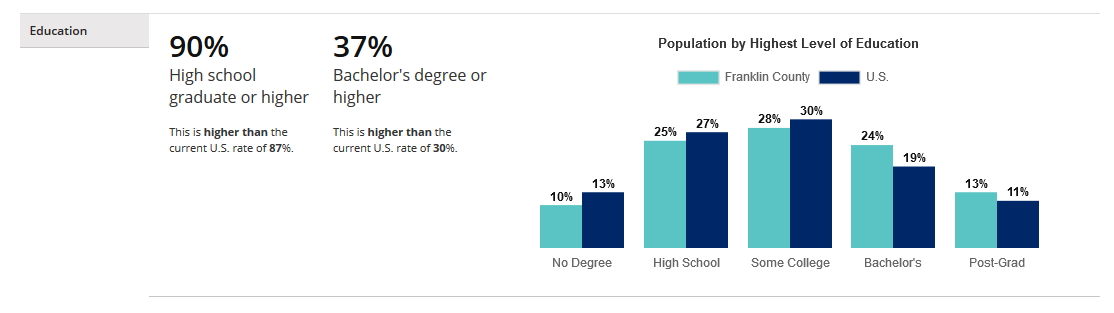
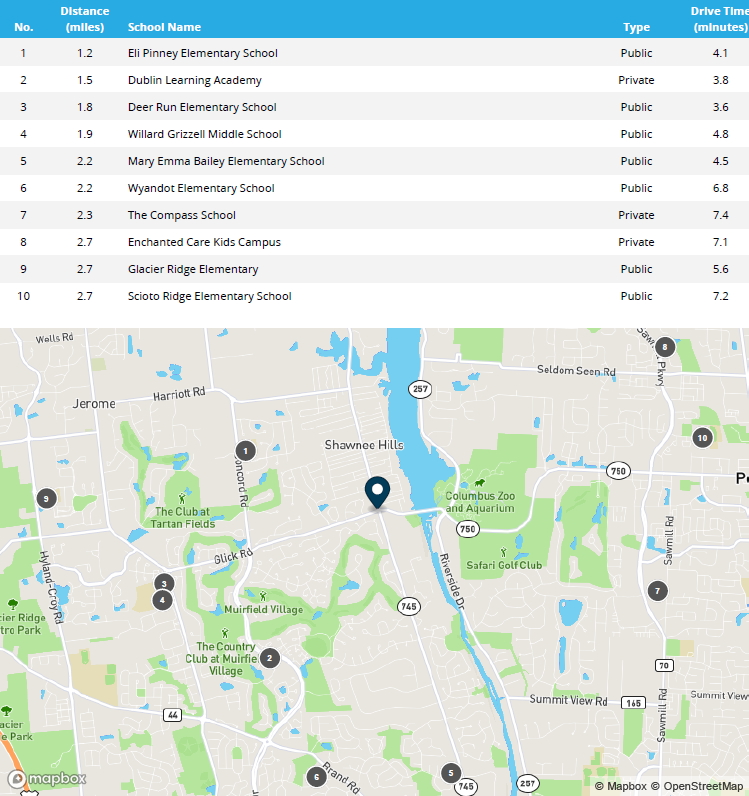
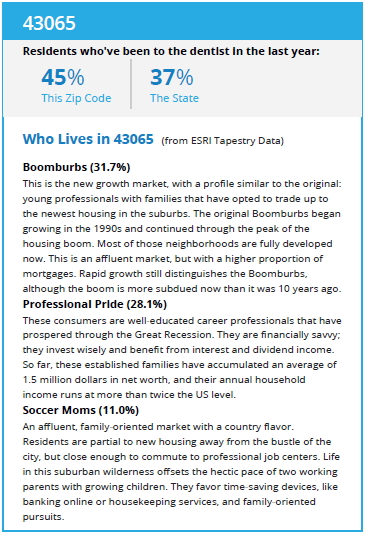
In addition to the newly released County Report, we have also massively updated our most popular product, the Single Site Study. If you’re not familiar with it already, the Single Site Study is an in-depth analysis which helps assess market opportunity for a dental practice at a particular location. In most cases, we’re analyzing either a potential practice acquisition or a property available for sale or lease. New features introduced include using drive times to collect demographic and competitive info, more detailed keyword research on your competitors, reporting on nearby schools and ESRI Tapestry summaries for five zip codes. The report, which costs only $349, is an absolute must before you commit to a six or seven figure investment.
If you haven’t already, I highly recommend that you download our sample reports and take a look for yourself at the latest in dental demographics.